AVC and NBAR2 Use Case Scenario1
This scenario revolves around a user experiencing degradation of critical business application performance due to BitTorrent utilizing a bulk of the WAN-edge bandwidth. With the help of LiveNX, and Cisco’s AVC and NBAR2 technologies, we will walk through the steps to troubleshoot and resolve the performance issue affecting the network.

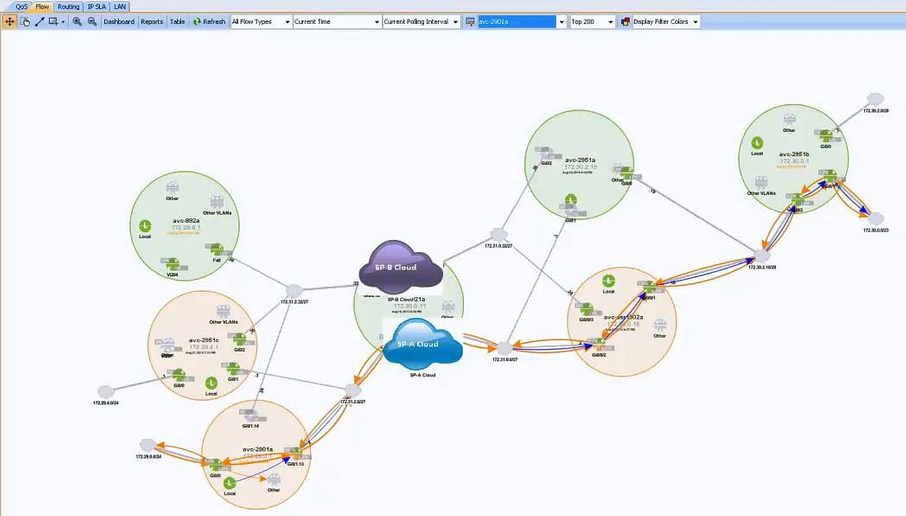
The current topology outlines the flow path between two sites, traversing a simulated Service Provider network. The majority of the scenario will focus on the avc-2901a router (bottom-left circle).
We begin with identifying the overall performance data of the top applications:
1. Right-click the device and select Flow, followed by Flow Report.
2. Under the Application (AVC) selector, choose Top Applications Performance.

Here we see that the Total Volume of BitTorrent is greater than our mission-critical application, Microsoft Office 365. Depending on how saturated the WAN link is, this could impact the users’ application experience. While this view is useful in identifying aggregate and average performance metrics, another option is to use view the data over time.
• Right-click on the desired application and select View data over time.
With the Microsoft Office 365 AVC flow selected, it is possible to see the reduction of the Performance Rate at approximately 8:00AM on August 24. The Performance Rate is the user’s perceived performance of the selected application, defined as (Layer 7 Traffic Volume) / (Transaction Time). In this case, Microsoft Office 365’s traffic volume is reduced due to BitTorrent’s heavy network saturation resulting in a lower performance rate. Conversely, if an increase in delay were to be introduced into the path then the Transaction Time would also increase, causing a reduction in the overall performance rate.

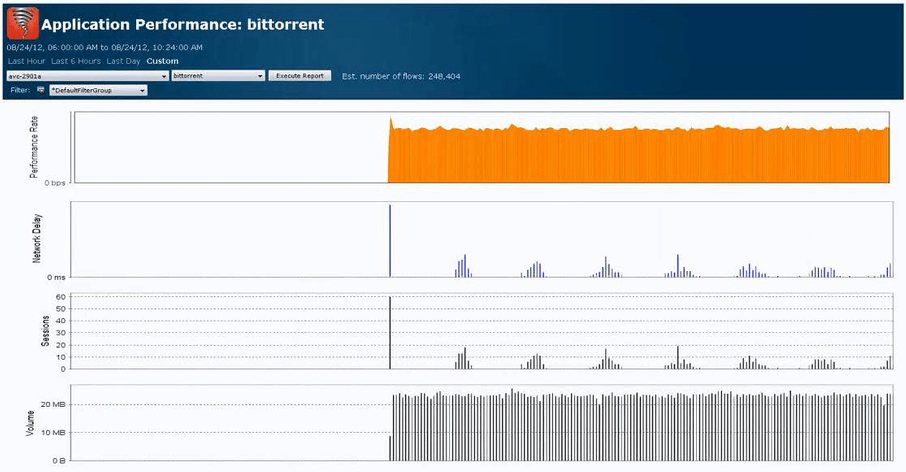
Now we take a look at BitTorrent’s Application Performance Report. The sharp increase in performance rate notes the start of the offending application around the same time that Microsoft Office 365 starts degrading.

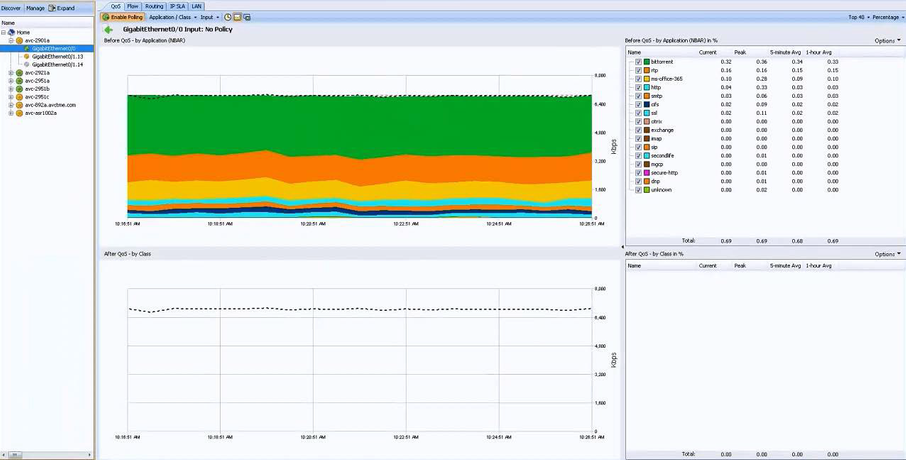
With that information in mind, we move into LiveNX’s real-time data provided by the QoS interface view. NBAR2 is currently performing its DPI functionality and is identifying BitTorrent as the top application entering the GigabitEthernet0/0 interface on the router, squelching all other traffic types.

In order to reduce the effects of BitTorrent on the network, a policing policy will be applied on GigabitEthernet0/0 – which also happens to be the interface closest to the source of the traffic. The simplest way to accomplish this is to create a monitoring policy based on the already known NBAR2 protocols.
1. Right-click on the graph which contains the protocols to monitor.
2. Select .
3. Save the configuration into the device.

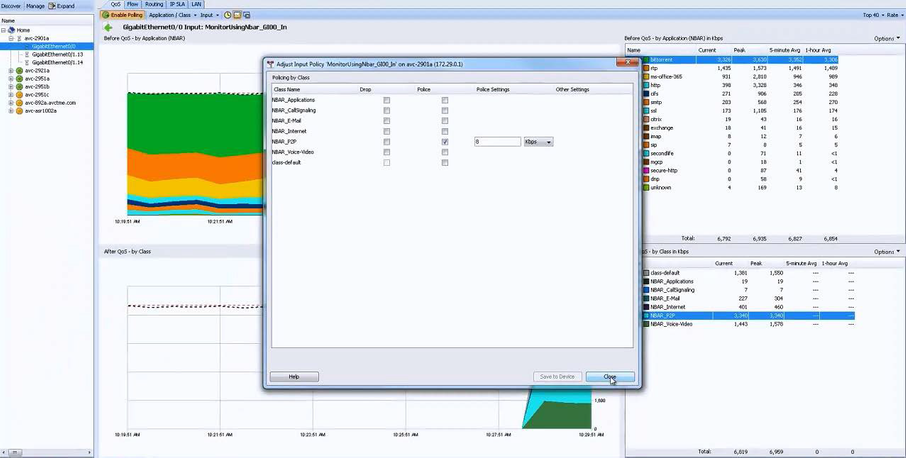
LiveNX will automatically create the policy and apply it on the interface. (Note: this policy can also be fine-tuned to meet the network engineer’s needs.) Soon, the After QoS – by Class graph will become populated by a class-based view on the matched traffic types. While it is labeled as “MonitorUsingNbar_GI00_In”, we can quickly apply a policing action on the class-map by right-clicking the QoS class and selecting Adjust Input QoS.
The following window will prompt us with the ability to Police a particular class and set a specified policing value. Keep in mind that 8Kbps is the lowest value possible for policing. While we could select Drop, BitTorrent is notorious for adapting to evade classification, when completely dropped. Policing on the other hand will greatly reduce the performance of BitTorrent, while preventing it from invoking its evasion algorithm.

The end result is a greatly reduced traffic count for BitTorrent, as shown by the “Before QoS – by Application (NBAR)” and “After QoS – by Class” interface graphs.

We can also verify the AVC performance values through the previously gleaned reports, which display a rise in Microsoft Office 365’s overall performance rate.

With this use-case scenario we can see how network administrators and engineers can utilize LiveNX and Cisco’s AVC functionality to completely understand application traffic on the network and also take the appropriate steps to optimize business critical applications.
1 Kangwarn Chinthammit, Technical Marketing Engineer, Troubleshoot and Resolve Application Performance with Cisco AVC and LiveAction, August 2012.